The Measure of Smart HR: Key Metrics Aligned to Business
By Ian J. Cook
Our business environment has been in constant flux since late in 2008. Much as we have become used to this new normal, the environment for HR people requires a new set of skills and new sets of information with which to make decisions and track outcomes.
New Normals, Change Ongoing
When business goals and strategies in flux, the timescales over which results are delivered and monitored become much shorter. There is also a tendency to stay away from long term, big investments in favour of more short term activities; these require less upfront spend and produce measurable results more quickly. Hence there is an increased need to be able to see clearly where the people challenges and opportunities lie—and to be able to deliver programs, with short time frames, which deliver a tangible difference to the organization.
For example, in the past the typical engagement survey would include the whole organization. More and more we are hearing of “pulse” surveys which either include only a sample of the organization or take the pulse of a particular part of the organization where knowing how people are feeling about work is key. Along a similar vein, instead of developing leadership programs which cover all staff at a certain level, organizations are now focusing on which people will be heading up crucial areas for the business and investing heavily in their particular development.
Instinct and Intuition Not Enough
To deliver results in this dynamic scenario, with its more focused format and shorter timescales, HR practitioners need to be able to see, analyze and interpret what is going on with the people inside and outside of their organization. Moreover, they need to do this work based on facts and evidence, as opposed to instinct and intuition.
When the rest of the business is presenting investment requests based on pages of data and analysis, it is not credible to put in a request because it feels right or because the competition are doing it. The requests and initiatives need to be supported with a strong evidence base and robust analysis. It is for this reason that the area of HR investment that is increasing most quickly is workforce analytics1.
The HR Metrics Service was launched four years ago with the express purpose of putting the right type of data into the hands of HR leaders to enable them to generate and present their strategic initiatives based on credible insight. Now, let’s explore some key points from the high level data and trends generated.
Productivity Shows Positive Trend
The primary function of any organization is to produce value for as little input as possible. When it comes to HR, the thread that runs through all hiring, development and promotion decisions is, ‘Will this help make the organization more productive?’ As there are many factors which impact overall organizational productivity, this makes it hard to look at the HR impacts in isolation. What is important is to monitor how productivity is changing over time and then analyze whether or not HR can play a role in helping to generate improvements or correct poor results.
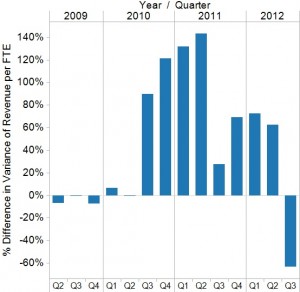 The first chart shows how Revenue per FTE has varied relative to Q1 of 2009. By showing percentage change to a fixed point we can determine if overall, organizations were getting more of less productive over the time period to Q3 2012.
What this chart shows is some improvement in Revenue per FTE through 2010, 2011 and early 2012. The significant drop in Q3 2012 correlates to the period where there was uncertainty over the US presidential election and whether the Eurozone would collapse. Both of these issues are now settled and the indicators are that Revenue per FTE is back on the rise. In 2013 many organizations are looking to grow revenue through growing new markets or acquiring companies.
The challenge for HR will be to work out how to maintain the productivity gains of the last couple years while needing to add more people to support the growth of the business.
Absence Another Key Area
Another key area that impacts productivity is absence. Absence is a normal part of organizational life, however there are wide ranges of absence that occur in organizations and it is one area that if effectively monitored and managed HR can demonstrate a tangible contribution to the organization.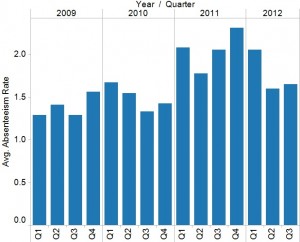
Back in 2010 the HR Metrics Service flagged that Absence rates were rising rapidly and that organizations should pay attention to this area. The chart below shows how average Absence Rates have changed over the last 4 years.
As the chart shows, absence rates continued to rise through 2011. However, in 2012 they have stopped their upward trend and look to be holding at close to the same level as 2011.
Here is where HR can demonstrate a tangible returns to their organization because the average day absent costs an employer a minimum of $300 dollars. There are many reasons for people to be absent and many of them are legitimate. HR groups looking to support a strategy of increased productivity or growth need to be certain they are managing the absences which are in the grey zone of legitimacy or where employees are taking advantage of the system.
Talent Supply and Vacancy
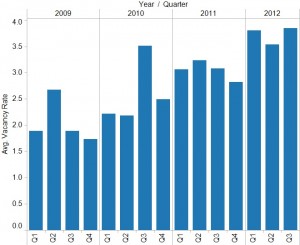 The next area that will be important to understand and develop a proactive approach to solving is the whole process of talent supply—sourcing/selecting and retention alike. Most of us have seen the long term projections for talent gaps and the press stories about a skills shortage. The chart below shows just how quickly the number of positions vacant has increased across Canada even though the unemployment rate has been slow to reduce.
Vacancy can be a very difficult challenge for organizations. Not having the right people in place has immediate impacts on productivity. According to a Pricewaterhouse Coopers study, one in four CEO’s has held back on a project because of not having enough of the right people. As a result, while organizations are looking to grow, the increased pace of the vacancy rate prior to 2012 suggests challenge; the process of finding and keeping good people is only going to get harder.
Local Labour Market Impacts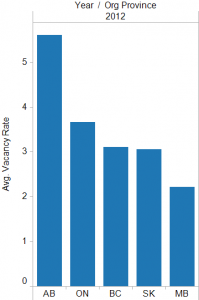
Vacancy is also very dependent on the local labour market context. The chart below shows the average vacancy rate by province for 2012. You can see how much larger the vacancy rate is in Alberta compared with the other provinces. Given how mobile people are these days, it is important to understand not just your local labour market conditions, but those of the geographies around you to which your employees might be willing to move
Resignation on the Rise
Vacancy rates should not be viewed in isolation. There is a reason why the unemployment figures do not follow the vacancy figures and that is because most hiring moves actually come from employment to employment. For this reason it is important to review and understand what is happening to resignations at the same time that vacancies are increasing. The chart below shows how the average resignation rate has varied relative to Q1 of 2009. You can see that in 2011 and 2012 the average resignation rate is 150% – 200% higher than it was in Q1 of 2009.
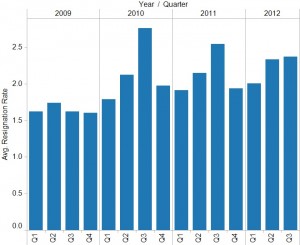 Resignations are costly to an organization. The average cost to replace a salaried employee is 1.5 times their annual salary. Moreover, the hidden costs that organizations are incurring through roles being vacant (key knowledge and relationships leaving the organization, impacts to work teams and others) is increasing.
At the same time, executive leaders in organizations are now becoming more aware of the impacts that a lack of people or the wrong people have and are looking for solutions.
Supporting productivity through talent supply
When the goal of HR is to align their activities to the strategic priorities of the business then it becomes clear that managing impacts to productivity such as absence rates, vacancy rates and resignation rates is critical. The reason these challenges exist is also what makes them very complex to overcome.
How do you fill vacancies when your talent pool has moved elsewhere? How do you retain your key staff when so many other organizations are ready to poach the best ones?
Many of the answers lie within the data inside your organization. For example, if you have a model to predict resignations you can invest your limited HR time focusing retention efforts where they will have most impact. Again, if you have a workforce plan which shows who may leave from where and when you can run your recruitment strategies to meet projected demand—rather than simply hiring after the fact.
The next stage is to gather good quality data on the capabilities and progression of your employees. Using this data, you will be better placed to spot the great talent within your organization and build the people that can fill critical positions—rather than constantly seeking them outside of your organization.
The high level data shows clearly how organization’s strategies and goals are being impacted by people. Creating effective, timely and focused responses will require organizations to gather and analyze their own workforce data. Only by factoring both the external context and internal dynamics is HR able to further its position as a strategic contributor to the business.
Ian J. Cook, CHRP, MBA is recognized for his leadership and insight in the area of workforce analytics and planning. He recently joined Visier, to build out the depth of insight available within this leading edge application.
(PeopleTalk Spring 2013)


